My expectation for West Texas Intermediate (WTI) oil prices for July is unchanged from June. That is, WTI should range from $75 to $95 per barrel. A narrower range is from $77.50 to $87.50 per barrel. This is the fourth month in a row where my expectations have been unchanged.
On Friday, June 21, WTI finished the day at about $80.50. A month ago on May 20, WTI traded for about $79.50, a dollar less per barrel. Yet many oil equities were trading about 5 to 10 percent higher.
Several Canadian oil and gas investors on X (formerly Twitter) attributed this fall in value to the upcoming June 25 deadline for increased capital gains taxes. Canadian taxpayers who have more than CA$250k (about US$182k) in capital gains will have their inclusion rate increased from one-half to two-thirds. In other words, two-thirds of capital gains in excess of CA$250K will be taxed. For further information, please see the Canadian government document “Fair and Predictable Capital Gains Taxation.”
This tax rate increased created an incentive for Canadians to sell their oil and gas holdings that have increased substantially from the lows during the COVID period. The question is whether this taxation selling is the primary cause for oil equities residing at lower values today than a month ago. I will show that the answer is no, the lower oil equity valuations are not attributable to the capital gains tax increase.
Please note that I will use US, as opposed to Canadian, stock prices and will use adjusted stock prices that compensate for stock splits and dividends.
Looking at the correlation table below, we see that correlations are strong for all pairs of oil equities. The equities are Chevron, Canadian Natural Resources, Devon, MEG Energy, Suncor, and Exxon.
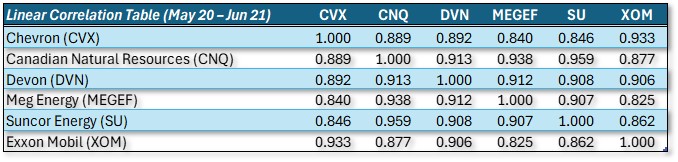
Table 1: Linear Correlation Table
The highest correlation is between CNQ and SU at 0.959. This result is not surprising because both are large, integrated Canadian oil sands producers.
Below is a scatterplot of CNQ versus SU.
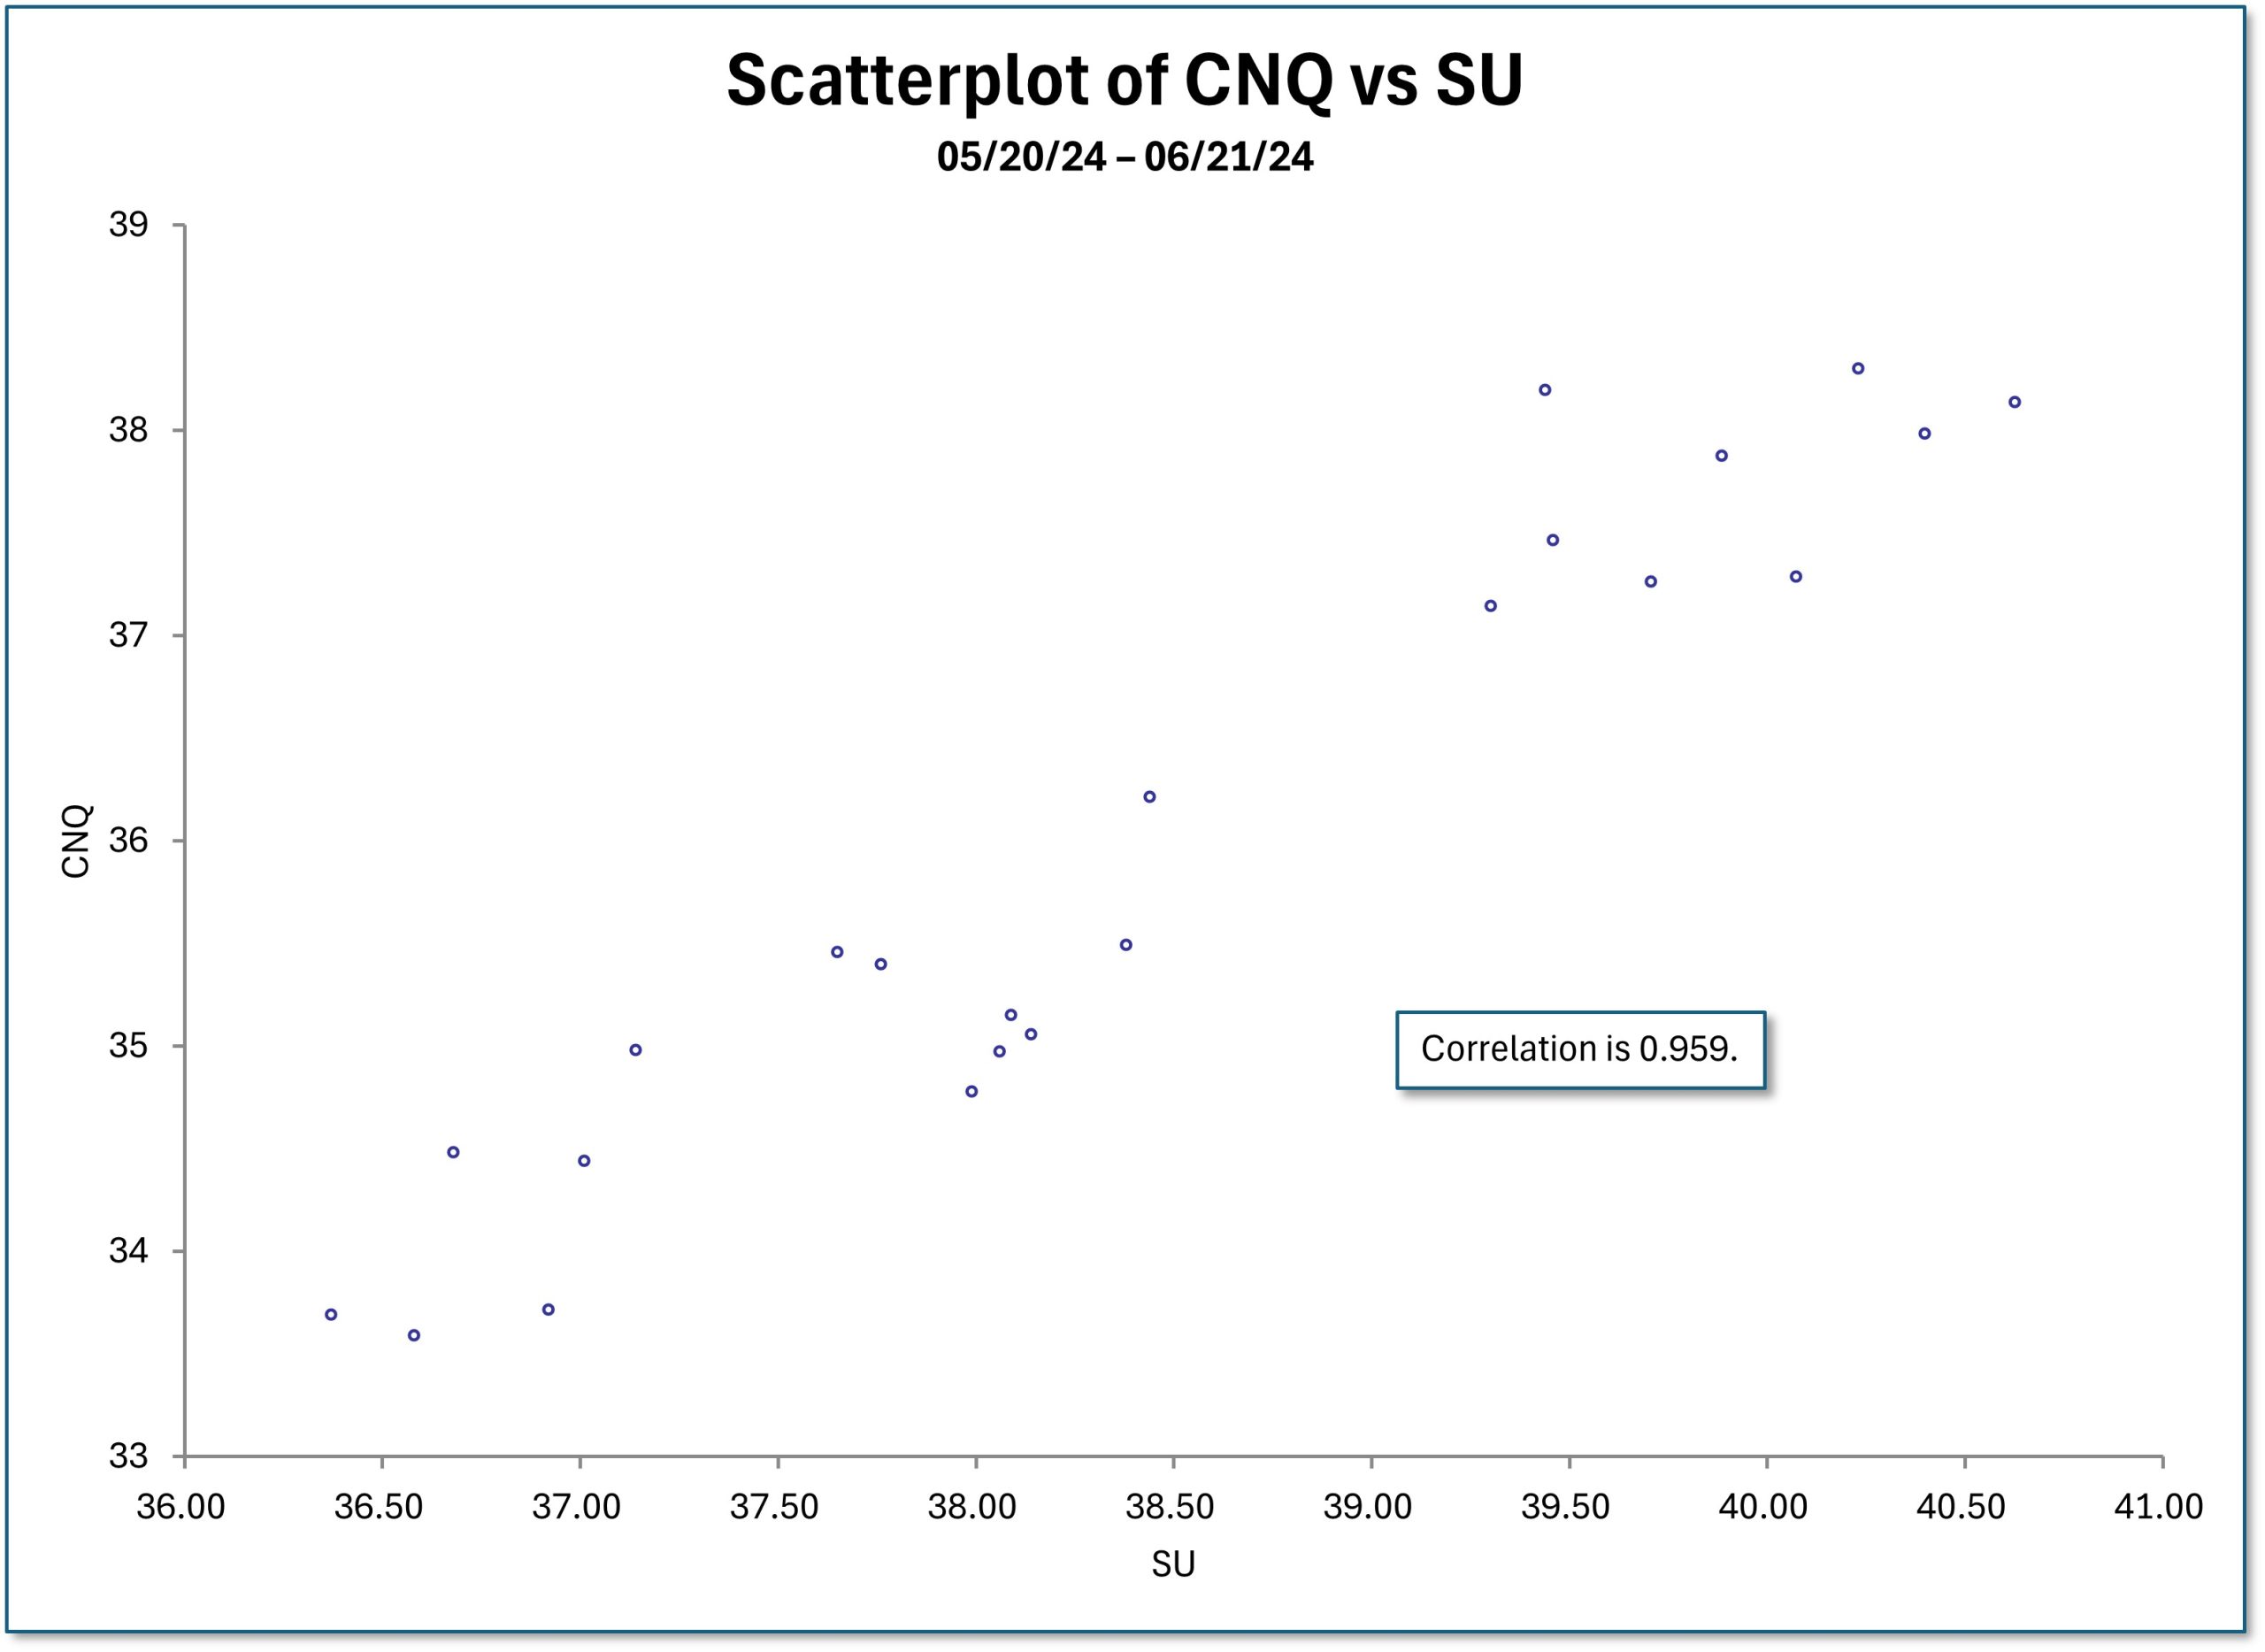
Figure 1: Scatterplot of CNQ vs SU
The lowest correlation is between MEGEF and XOM at 0.825, which is still high. This result is expected because MEGEF is a midcap oil sands company producing bitumen, and Exxon is a large integrated company.
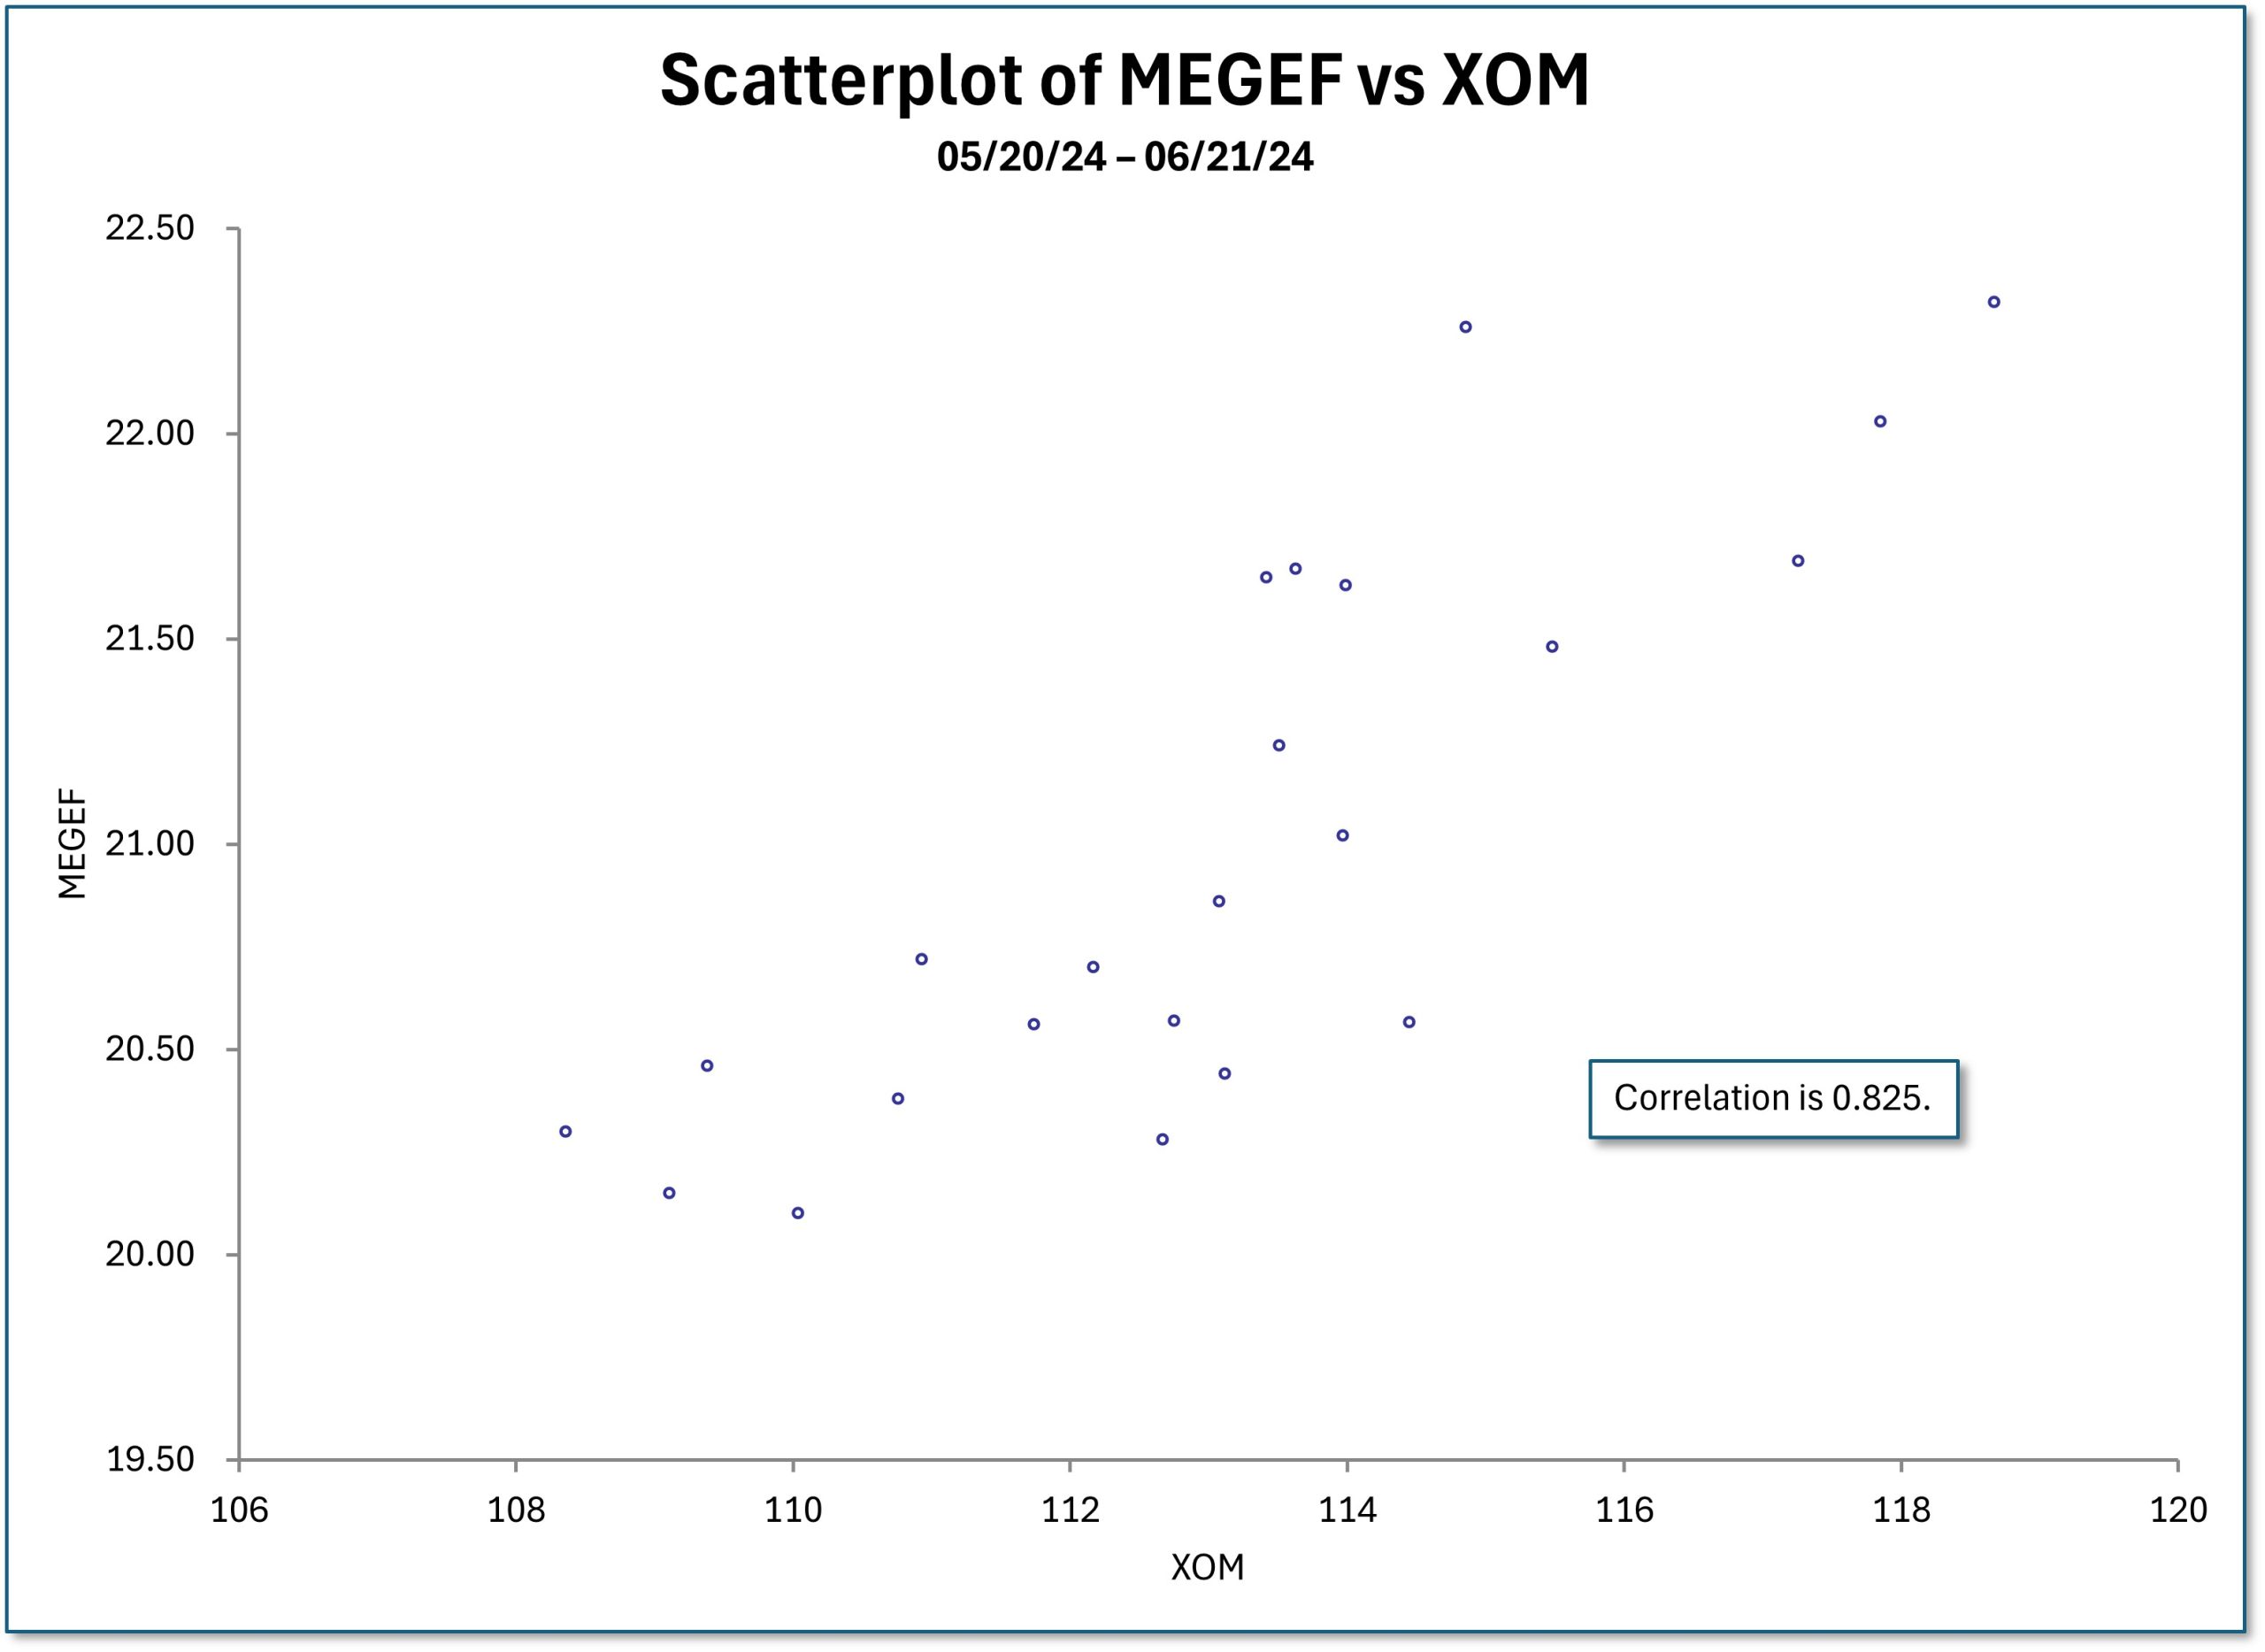
Figure 2: Scatterplot of MEGEF vs XOM
The correlation between MEGEF and DVN, Canadian and American midcaps, is higher at 0.912.
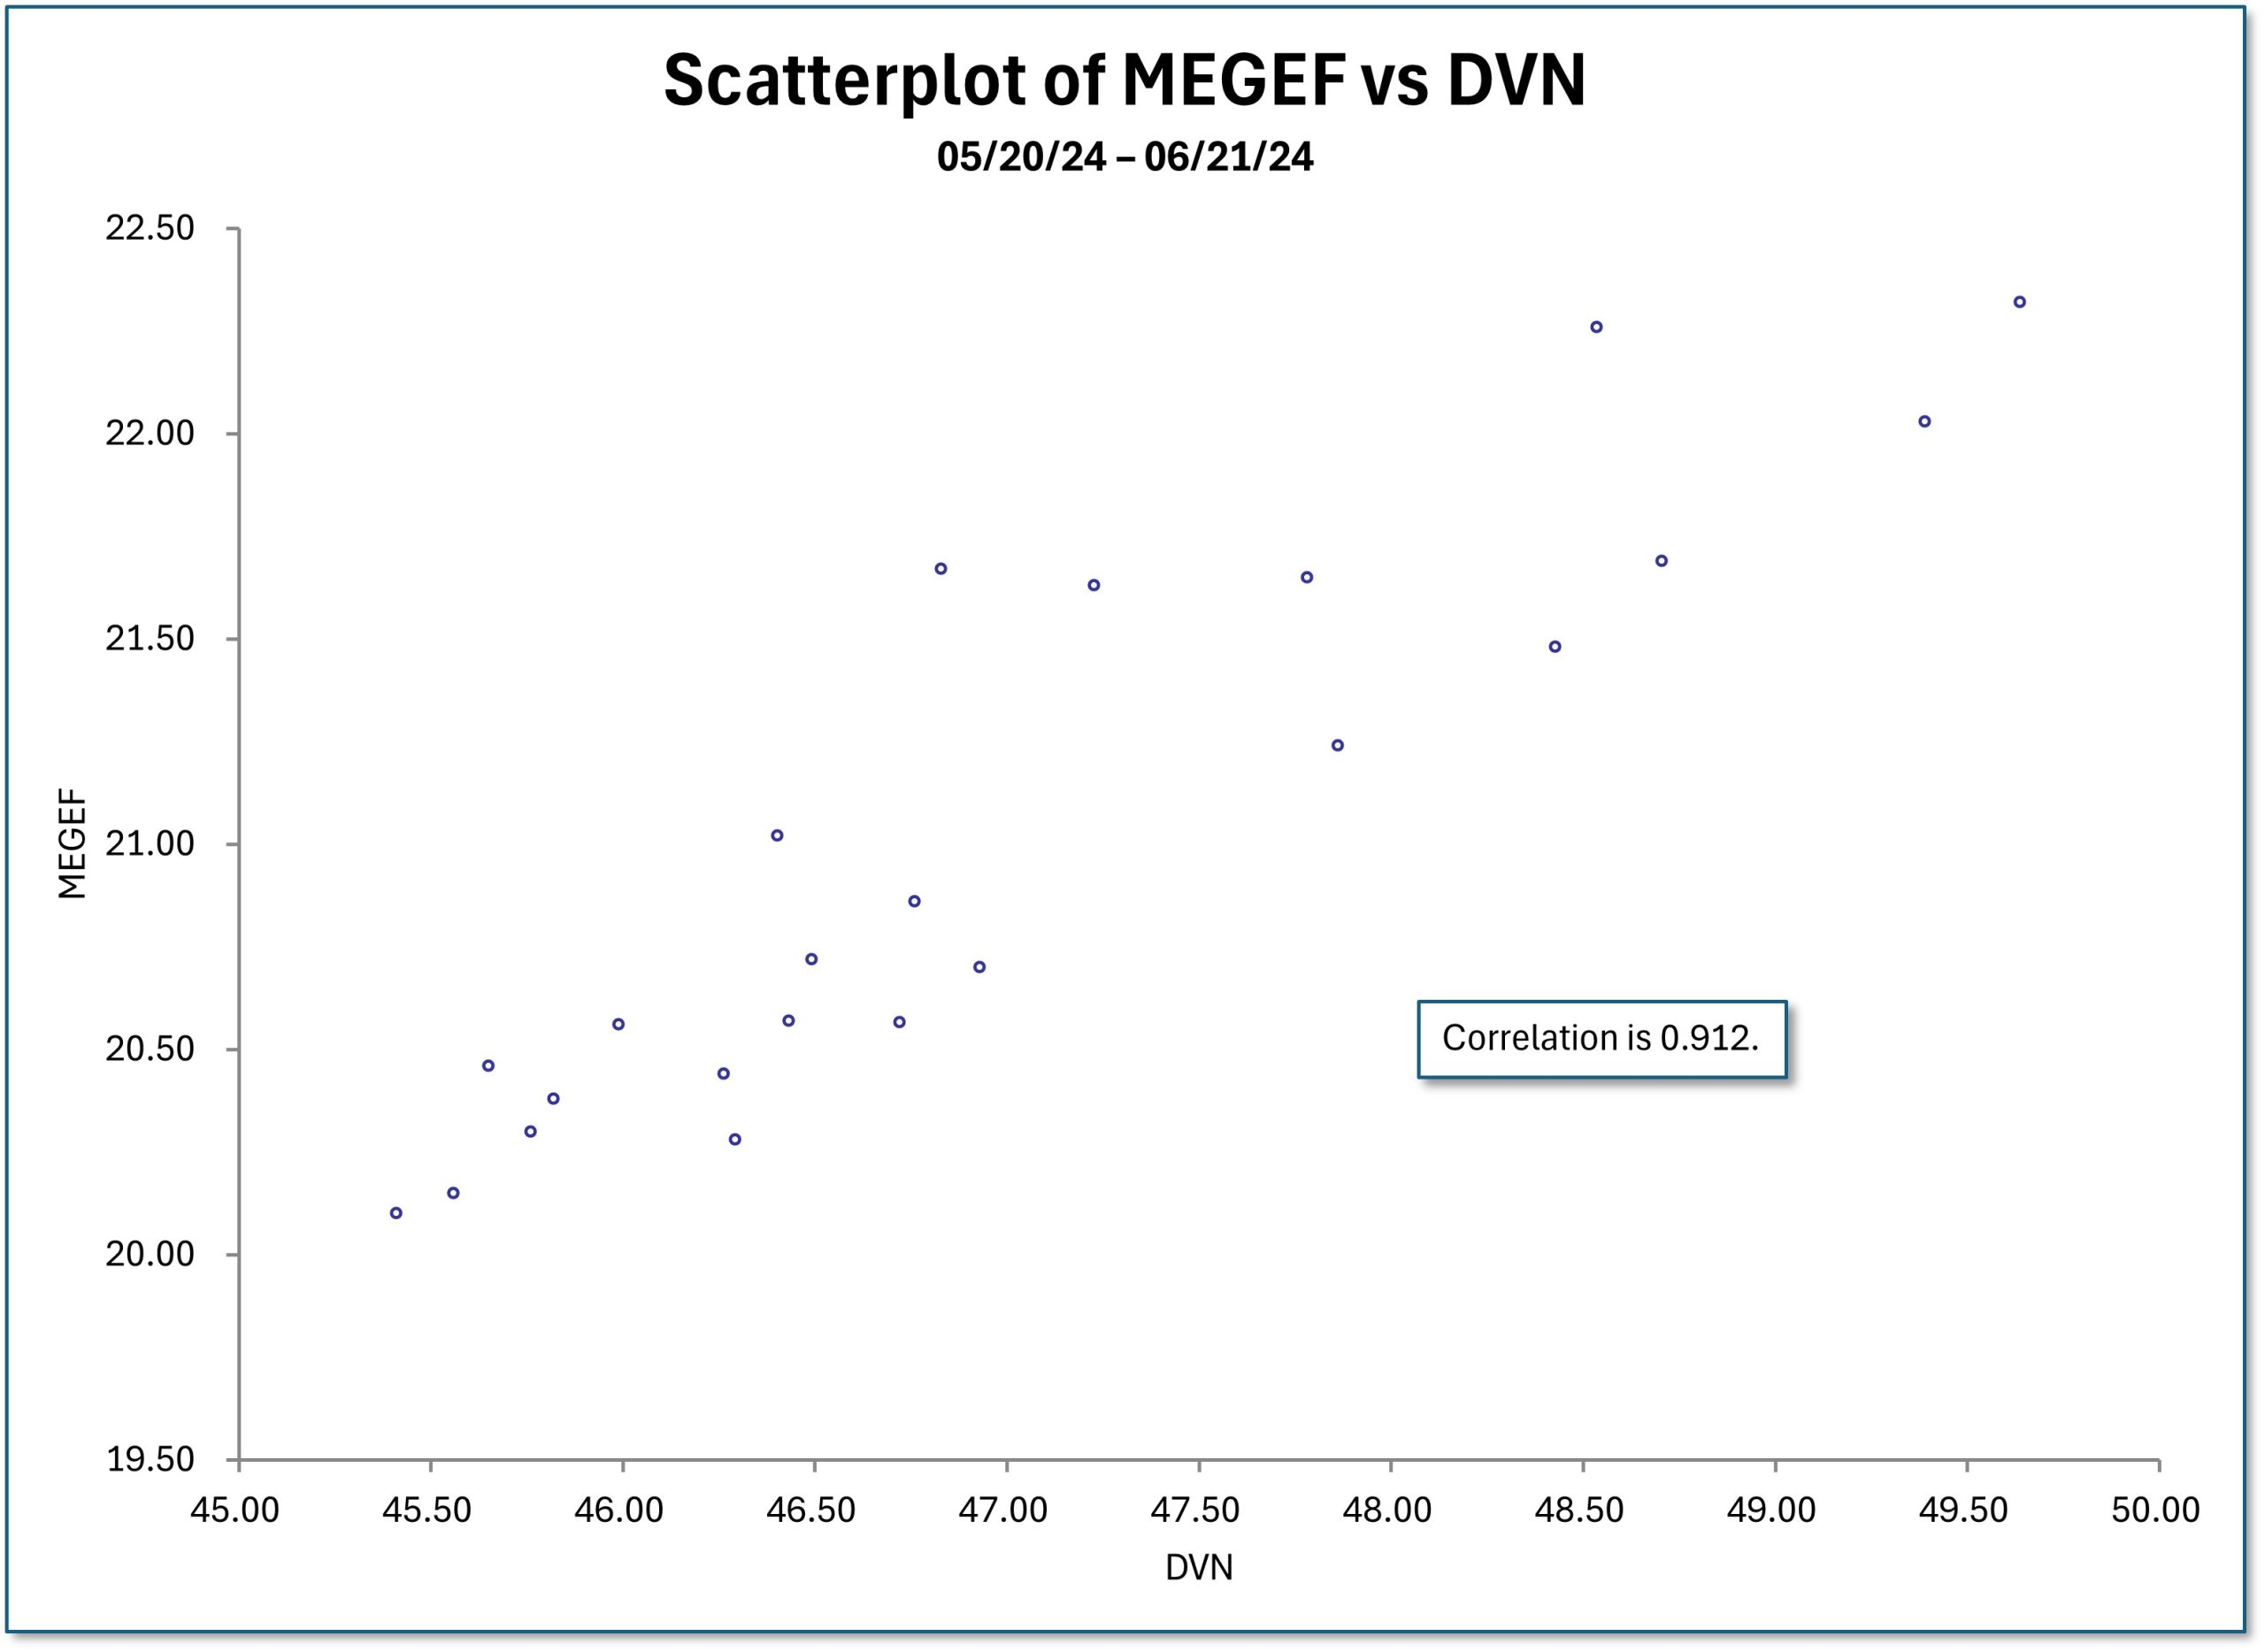
Figure 3: Scatterplot of MEGEF vs DVN
And finally, the correlation between two large integrated companies CNQ, Canadian, and XOM, American, is 0.877.
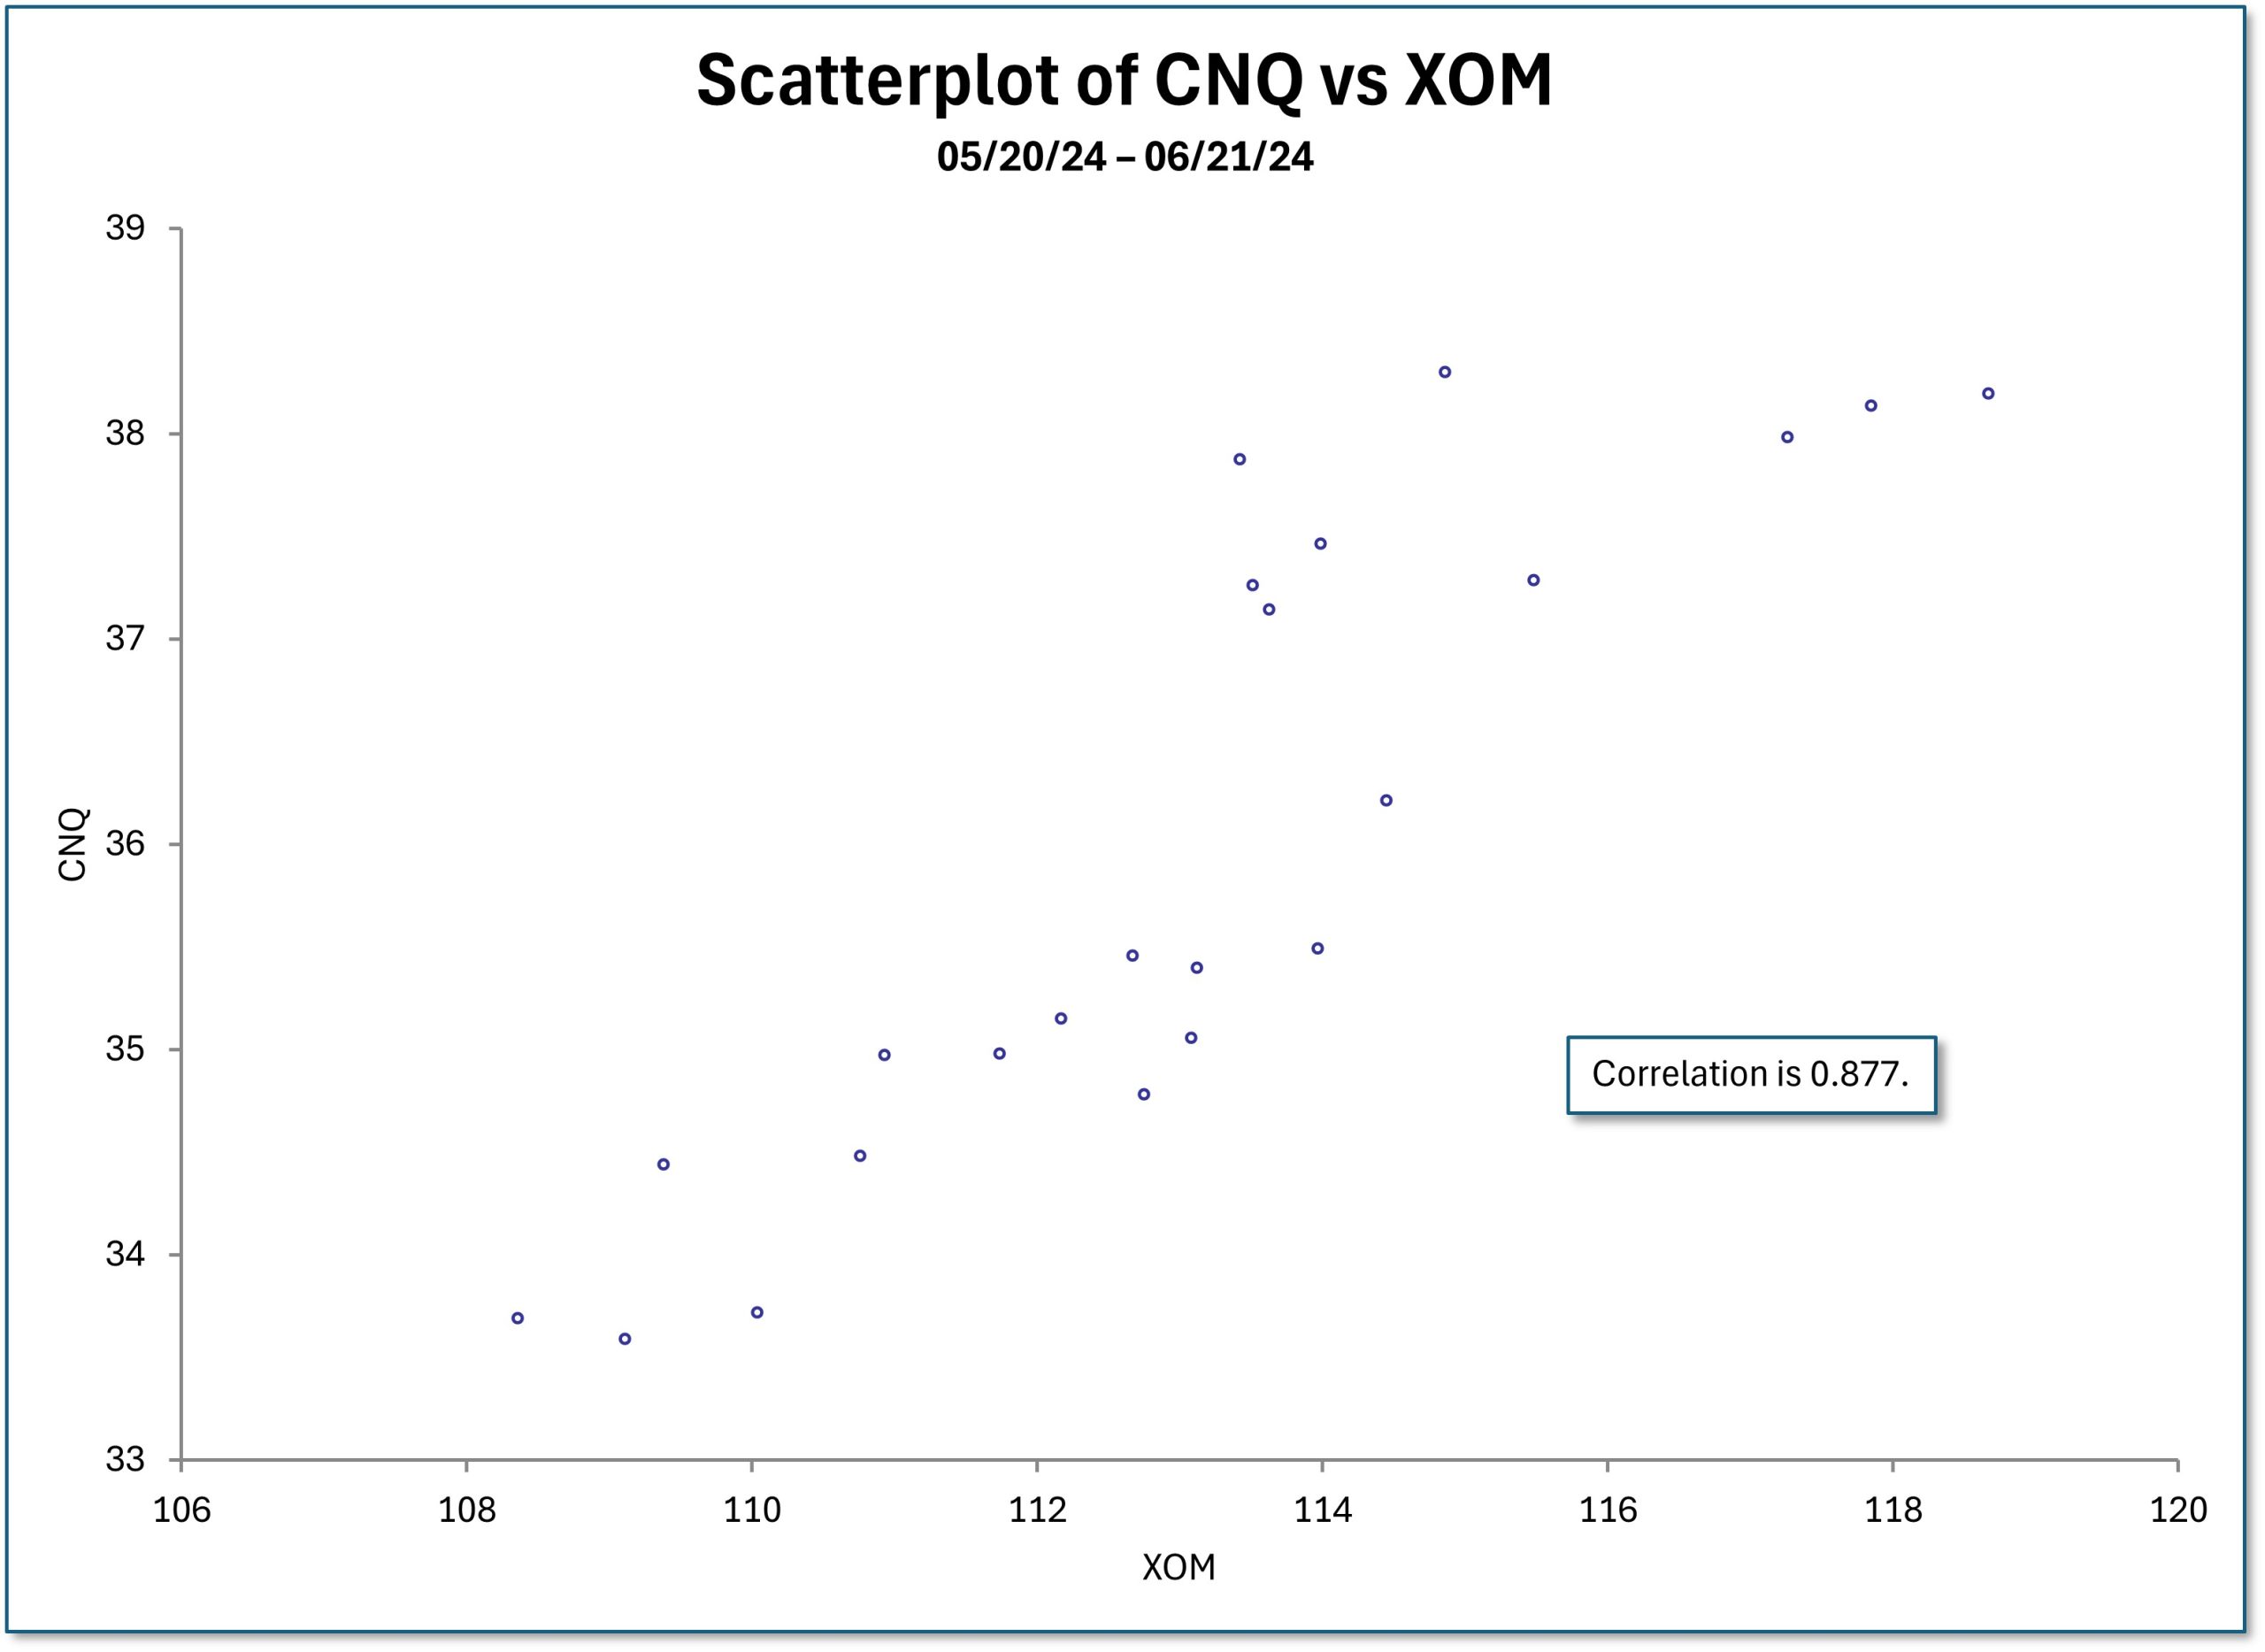
Figure 4: Scatterplot of CNQ vs XOM
The correlations between any two of these six companies are high, regardless of whether the companies are American, Canadian, or a mixture. While Canadian investors might have some influence on Canadian companies, they will have negligible influence on large-cap American companies.
If smaller Canadian retail investors wanted to reset their cost basis, they could have sold and immediately repurchased their shares. If a larger Canadian investor with a large number of shares wanted to sell and repurchase her shares, she could have engaged in a combination trade. Let us walk through an example. Say an investor has 100,000 shares of CNQ, which closed at US$34.48 that she wanted to sell and repurchase for nearly the same price. Dumping 100k shares on the market immediately would likely affect the stock price. So as last Friday came to a close, she could have executed the following combination trade, where both parts are executed simultaneously, for a credit of $34.93:
- Sell 100,000 shares of CNQ
- Sell 1,000 CNQ put contracts for June 21 with a $35 strike
Selling the 100k shares is understandable. When the investor sells 1,000 June 35 puts, she provides the counterparty or market makers with the right, but not the obligation, to sell 100k shares of CNQ at $35. The credit of $34.93 provides the market maker with a $0.07 per share incentive to execute the trade. Typically, the market maker will likely require $0.05 to $0.10 per share to execute the trade. The net effect for our imaginary investor is that she gave up $0.07 per share to sell and repurchase her shares on Friday.
If she entered the trade earlier in the day and wanted to ensure that the puts would be in-the-money at the trading close, she could have chosen the $36.25 strike instead of the $35 strike. In that case, the credit would be $36.18, again just $0.07 per share less than the strike price.
As far as the increase in Canadian capital gains taxes are concerned, they were not a major contributing factor in driving oil equity valuations lower. The correlations between any two oil equities in table 1 are high. Furthermore, Canadian investors could have easily sold and repurchased their shares through put assignments during the last several weeks and months. The reason for oil equities trading lower with oil prices at current levels remains a mystery.
Away from Canadian capital gains taxes and back to the original topic of oil prices, there have been no fundamental changes that have caused a reevaluation of my WTI range. While there were announcements by OPEC+, IEA, and EIA during the early June, nothing has fundamentally changed. So my outlook stays the same.
Disclosure: long and short CNQ puts; long and short DVN calls and puts; long SU stock, and long and short SU calls and puts; and long and short XOM calls and puts.