
US Weekly Oil Production Versus US Oil Rig Count
With the recent release of the US Energy Information Administration’s Short Term Energy Outlook, I have revised downward my forecast for WTI oil price to between $45 and $55 per barrel for the next several weeks, until midsummer. The reason for lowering my forecast is that the EIA has forecast more production between now and roughly the end of 2018. Furthermore, in its “Forecast Highlights” it says the following: “EIA forecasts that implied global petroleum and liquid fuels inventories will decline by about 0.2 million b/d in 2017 and then increase by an average of 0.1 million b/d in 2018.” I anticipate that the forecasted build in inventories in 2018 might keep a lid on oil prices.
Let’s take a quick review of some data. You’ve likely seen a variation of the following graph where oil production has almost recovered to pre-downturn levels, yet the number of oil rigs being used is roughly half that at the peak of production. The key point from this graph is that production efficiency per rig has increased. It’s important to remember that this graph represents all rigs involved in US oil production, not just those used for shale oil.
One of the benchmarks that I track is the US Energy Information Administration’s Short Term Energy Outlook data for US crude oil and liquid fuels production as shown in the next graph, which is an updated version from the prior month. Every month the EIA releases a new forecast. The January forecast is the lowest line along the horizontal axis, and the June forecast is the top line for much, but not all, of the graph. Solid-line portions represent historical data, and the dotted-line portions are forecasts. Because of data revisions, not all months start from the same point. Please note that liquid fuels include ethanol, natural gas plant liquids, and biodiesel, and this total volume is different from just the oil volume shown in the prior graph.
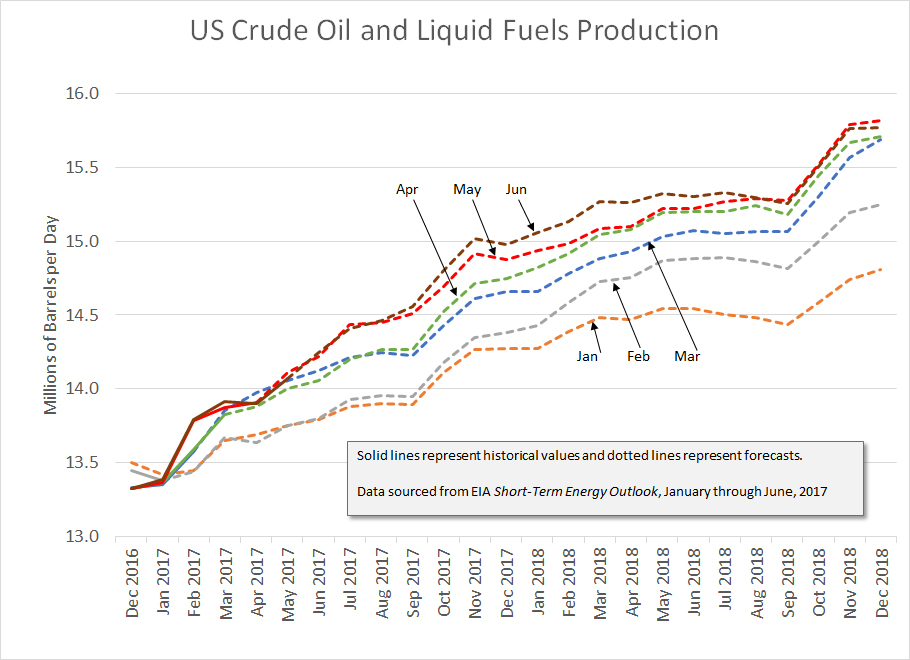
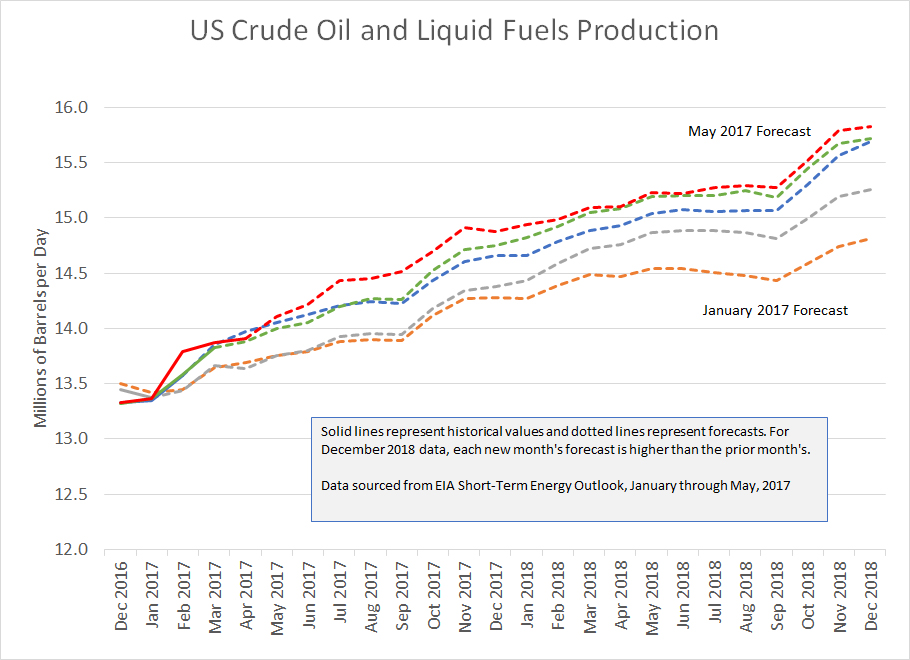
EIA Short Term Energy Outlook Forecasts
In February and March, the EIA revised substantially upward its December 2018 production forecast. In the last four months, the December 2018 production forecast remained relatively constant, but the production volume leading up to December 2018 was increased with each new forecast.
With production forecasts increasing each month and with the EIA forecasting a slight build in global inventories, I am more cautious. I want to wait for more data throughout the summer. Do global inventories draw down faster than many expect, or do they remain relatively stable?
In this weekend’s Barron’s magazine article (subscription required) “Energy Shares Could Soon Heat Up,” Andrew Bary discusses bullish comments made by Morgan Stanley’s energy analyst Evan Calio.
The Energy Select Sector SPDR exchange-traded fund (ticker: XLE), which tracks the energy stocks in the Standard & Poor’s 500 index, is off 12% so far in 2017, compared with a 9% gain in the broad market. The more volatile SPDR S&P Oil & Gas Exploration & Production ETF (XOP) is down 21% after hitting a new 52-week low last week. “This is one of the worst beginnings to the year ever,” says Evan Calio, an energy analyst at Morgan Stanley. “Investor sentiment is horrible.”
Nevertheless, Calio remains upbeat on U.S. exploration-and-production stocks, seeing about 15% upside on average from current levels. He expects oil prices to rise to the mid-to-high $50s over the summer and into the fall, supported by drawdowns of crude inventories and the effect of output reductions announced by the Organization of Petroleum Exporting Countries. A rally in energy stocks could be under way, after their 2% gain on Friday.
Calio is more bullish than I am at present. If, however, global inventories deplete faster than expected over the summer, I will reverse my current position and go back to my prior expected range of $50–$60 per barrel.
Recent Comments