I expect West Texas Intermediate oil prices to range between $35 to $45 per barrel for July. If oil prices go below $35, I do not expect them to stay there for long. If, however, prices surpass $45, they might stay at that level.
Although I gave a range of between $30 and $40 per barrel for June, prices have stayed about $35 so far, with prices even slightly exceeding $40 for a brief period. Even with the current outbreaks of COVID-19 in a few states, I believe this upward trend will continue. I expect governments and people will learn how to cope with the coronavirus. When the number of new cases spike up, more preventative measures will be reinstated. And given the current environment, OPEC+ might continue their cuts into August. Both actions will continue to reduce the glut of stored oil.
I also mentioned that investors with longer-term horizons consider the stocks of well-managed and well-capitalized oil companies. In early June, the stock prices of oil companies in general lifted, but then fell back down even as oil prices remained relatively firm. Although I am unable to explain why stock prices drifted back down, I continue to believe that good quality oil companies have attractive stock prices at these current levels.

Cumulative Number of COVID-19 Cases in Alberta
Some might point to the increased nervousness because of the coronavirus outbreaks as the reason for softening stock prices. If we look at Alberta’s number of COVID-19 cases, we see that the cases have leveled off. Should the numbers begin to spike upward again, I expect the government to roll back some of the opening measures. For example, perhaps bars will close or have more restrictions placed upon them.
I am going to take a slight detour to discuss semi-log graphs.
Some might have noticed that I used a semi-log graph to provide the Alberta coronavirus case numbers. The reason for using semi-log graphs is to show better the rate of increase. By using a traditional graph, it is difficult to detect changes in rates of growth.
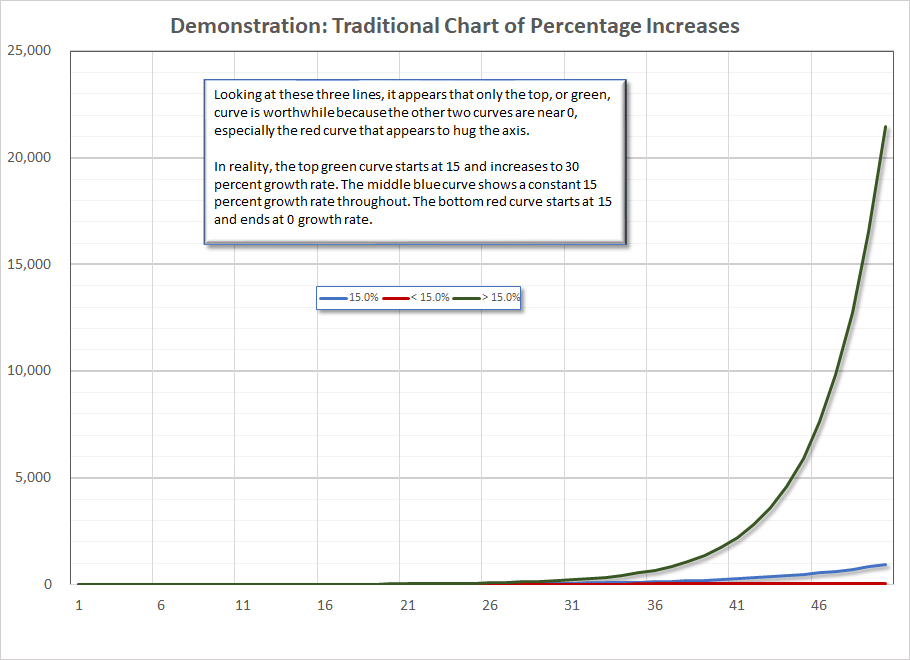
Traditional Chart of Percentage Increases
For example, I created a sample graph where there are three curves: one, the green curve that starts with a growth rate of 15 percent and ends with a growth rate of 30 percent; two, a blue curve that grows at a constant 15 percent throughout; and a red curve that starts with a growth rate of 15 percent and ends with a growth rate of zero percent. By looking at the graph with its three curves, we know that the green curve is growing rapidly because it goes parabolic and it completely overwhelms the other two curves. Furthermore, because the end value is so large for the green curve, it is hard to discern any data or trends in the first half of the period for any of the curves.
Next, I created a semi-log chart using the exact same data. The green curve is slightly convex because its growth rate increases throughout from 15 percent to 30 percent. The blue curve is linear throughout because it grows at a constant 15 percent. And the red curve is concave because its growth decelerates from 15 percent to zero percent.
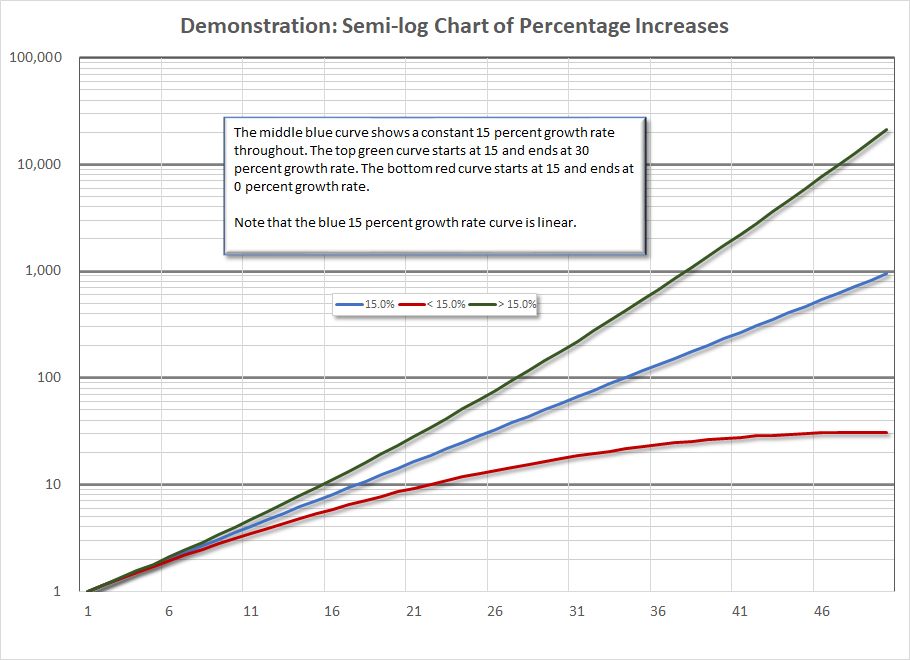
Semi-log Chart of Percentage Increases
If you are interested, you can download the Excel spreadsheet and play with the values yourself.
When we look at graphs showing the number of coronavirus cases, steeper curves show faster growth rates, linear curves show constant growth rates, and flatter curves show almost no growth rate. Going back to the first graph with the number of Alberta COVID-19 cases, we note that the growth rates was high in first week or so. That is expected because of the low base values. Then the growth rate decelerated from mid-March to early May. From early May onwards, the growth rate has plateaued. When I look at the numerical data, the growth rate for about the last month is roughly 0.5 to 1 percent per day.
Returning back to the topic of July’s oil prices, I expect that Alberta will watch the number of coronavirus cases and will, if necessary, adjust the preventative measures to keep the growth rate at a low value so that our social infrastructure can cope and to save and protect the health of Albertans. I further expect most jurisdictions to follow this same path.
Wrapping up, I expect WTI prices to range between $35 to $45 per barrel for July. Most jurisdictions will manage their policies so that the coronavirus growth rates moderate or stay low. OPEC+ might prolong their production cuts into August. Both measures are likely to reduce the glut of stored oil and push prices higher. And I continue to believe that stocks of well-managed and well-capitalized oil companies represent good value, but you and your financial adviser are responsible for your investment decisions.